The Organization for Economic Cooperation and Development (OECD) has released its 2013 scorecard or, more officially, the OECD Science, Technology and Industry Scoreboard 2013 (which you can find here). There’s a brief description of the 2013 scorecard on the webpage housing the complete report/scorecard and various publications derived from it,
Science, technology, innovation and entrepreneurship – which foster competitiveness, productivity, and job creation – are important mechanisms for encouraging sustainable growth. The 260 indicators in the OECD Science, Technology and Industry (STI) Scoreboard 2013 show how OECD and partner economies are performing in a wide range of areas to help governments design more effective and efficient policies and monitor progress towards their desired goals.
The 2013 scorecard highlights concerning Canada are (from the OECD Science, Technology and Industry Scoreboard 2013
: Canada publication),
Canada experienced a decline in business spending on R&D between 2001 and 2011, despite generous public support, mainly through tax incentives for business R&D. As a percentage of GDP, Canada’s tax incentives for R&D were the largest after France in 2011. [emphasis mine]
Despite relatively limited investment in R&D, a large share of Canada’s manufacturing and services firms are involved in innovation. Canada is among the group of countries where high-technology industries still dominate patenting activity, while in several other OECD countries business services now account for the largest share of patents. Canada lags somewhat in the proportion of young firms applying for patents, however.
Canada achieves a relatively high impact with its scientific research. Compared with other large OECD economies, Canada has a very high rate of international mobility of researchers, mostly with the United States. Returning researchers and new inflows tend to publish in journals with higher quality than researchers that have not engaged in international mobility.
Canada’s trade performance is characterised by a strong focus on primary products, which affects its positioning in global value chains. This contributes to a relatively low foreign (and thus a high domestic) value added content in Canada’s exports, which declined between 1995 and 2009. In 2009, over 26% of jobs in the business sector were sustained by demand from abroad, down from just over 30% in 1995.
So, despite some of the best tax incentives amongst OECD countries, business in Canada spent less on R&D as the decade wore on. Interesting. Especially so since the government, realizing there were problems of some kind, commissioned Tom Jenkins (Chairman, OpenText Corporation), along with a committee,, to examine the various government tax incentive programmes developed for business R&D. This resulted in what is known as the Jenkins report (featured in my Oct. 21, 2011 posting) and changes, based on the recommendations, such as more incentives for partnerships between universities and businesses and a major change of focus (funds for science that will make money) for one of the granting agencies (mentioned in my May 22, 2013 posting). Given that Canada already had good incentives for business R&D before 2011, why did the government implement more incentives after the 2011 Jenkins report since it seems that the incentives might not be the problem. Here’s more about the situation prior to the changes stemming from the 2011 Jenkins report, from the OECD’s 2013 scorecard: Canada Highlights,
Canada is among the few OECD countries where R&D expenditure declined between 2000 and 2011 (Figure 1). This decline was mainly due to reduced business spending on R&D. It occurred despite relatively generous public support for business R&D, primarily through tax incentives. In 2011, Canada was amongst the OECD countries with the most generous tax support for R&D and the country with the largest share of government funding for business R&D being accounted for by tax credits (Figure 2). …
OECD and key nanotechnology indicators
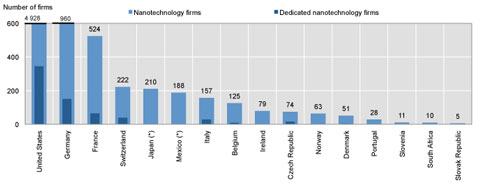
At roughly the same time as the OECD Science, Technology and Industry Scoreboard was released, there was this Oct. 25, 2013 news item on Nanowerk about an October 2013 update of the OECD’s key nanotechnology indicators (Note: A link has been removed),
i have looked at some of the nanotechnology key indicator spreadsheets provided by the OECD and the only one of my admittedly small sample that lists Canadian performance was in the Share of countries in nanotechnology patents filed under PCT, 2008-10. Apparently Canada did not submit data about Number of firms active in nanotechnology, 2011 or latest available year or Nanotechnology R&D expenditures in the business sector, 2011 or latest available year.
*Added ‘Science’ to the head as in ‘… Science, Technology and Industry Scoreboard 2013’ on May 29, 2014.
