What a fabulous idea! The Bard Graduate Center for Studies in the Decorative Arts, Design, and Culture is holding an exhibit of Benoit Mandelbrot’s images from Sept. 21, 2012 – Jan. 27, 2013 in New York City (from the July 31, 2012 announcement)
The Exhibition
Focusing primarily on the work of Benoît Mandelbrot (1924–2010), one of the most notable mathematicians of the twentieth century, this exhibition explores the role of images in scientific thinking. With their capacity to generate and shape knowledge, images are at the very core of scientific investigation: charts, graphs, notebooks, instrument readings, technological representations, even mental abstractions–all make up the essential stuff of which it is made.
For thousands of years, Western thought assumed that the fundamental geometry of the world consisted of regular, ideal forms (cubes, spheres, cones, et cetera) with straight or evenly curved faces and edges. Benoît Mandelbrot, however, decided to explore the mathematics of the world not in its idealized form, but as it actually appears, in all its untidiness and irregularity, devoting himself to the study, for example, of the forms of the coastlines of real islands, with all their unpredictable inlets, creeks, and furrows.
Mandelbrot, in other words, looked at the world. In so doing, he flouted what was in effect a prohibition in much of mathematics against the use of visual representation in the discipline. To reintroduce the visual there, Mandelbrot took the step of harnessing the potential of computers, transforming mathematics into an experimental science. The result was his invention of fractal geometry, a geometry of actuality rather than of abstractions.
At his death in 2010, Mandelbrot left a mass of idiosyncratically organized drawings, computer print-outs, films, manuscript scribbles, objects, and photographs in his office in Cambridge, Massachusetts, an extraordinary trove to which Mandelbrot’s wife, Aliette, generously allowed Bard Graduate Center Visiting Assistant Professor Nina Samuel access. To explore it was like wandering through the mathematician’s brain—like witnessing the ephemeral traces of his very thought processes. Selections from these materials form the core of the exhibition.
Here’s a bit more about the exhibit and its curator from the undated press release,
Focusing primarily on the work of one of the most notable mathematicians of the twentieth century, The Islands of Benoît Mandelbrot: Fractals, Chaos, and the Materiality of Thinking, on view at the Bard Graduate Center from September 21, 2012 to January 27, 2013, explores the role of images in the development of what has become known as fractal geometry and chaos theory. Nina Samuel, a visiting assistant professor at the BGC, is the curator. Samuel, who received her PhD in art history from the Humboldt University of Berlin, is also an associate member of Das Technische Bild in Germany and a former member of the Swiss national research program eikones/NCRR Iconic Criticism.
…
“To explore it was like wandering through the mathematician’s brain,” said Samuel. “It was like witnessing the ephemeral traces of his very thought processes.” Selections from these materials form the core of the exhibition.
Along with this rare look into Mandelbrot’s working process, sketches from his contemporaries—the French mathematician Adrien Douady and the German biochemist Otto E. Rössler—will also be publicly exhibited for the first time. The work of the Massachusetts Institute of Technology meteorologist Edward N. Lorenz, a pioneer of chaos theory, will be represented by loans from the Library of Congress.
The writer has made some assumptions about the audience, from the press release,
The Islands of Benoît Mandelbrot: Fractals, Chaos, and the Materiality of Thinking allows the viewer to question the idea that the illustration of a work must always be secondary to the work itself. On the contrary, substantive images often play generative roles in the scientific process, constituting a kind of material thinking conducted by producing and interpreting visual traces, such as computer-generated images. These images are often aesthetically compelling even if they are initially scientifically impenetrable. This constitutes another revelation of the exhibition: the beauty of material thinking that can be found in the visual detritus of scientific investigation.
I think this exhibit is very much part of a trend towards re-examining how we create and organize ideas (scientific and otherwise) and, ultimately, how we think. I’ve a number of commentaries in the ‘visual data’ category for this blog, the most recent being Big data, data visualization, and spatial relationships with computers, which I finished with this thought,
I think the real game changer for science (how it’s conducted, how it’s taught, and how it’s communicated) and other disciplines is data visualization.
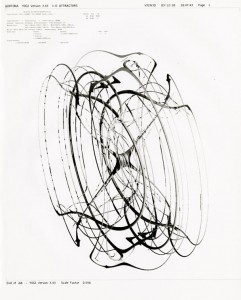
To whet your appetite for the ‘Islands of Benoit Mandebrot’, here’s an image from the exhibit,

Benoît Mandelbrot and Alan Norton. Computer graphic on photographic paper, 1983. Collection Aliette Mandelbrot.
There’s more information about the Mandelbrot exhibition on the event page including information about a book/catalogue being published, from the press release,
The Islands of Benoît Mandelbrot: Fractals, Chaos, and the Materiality of Thinking is accompanied by a fully illustrated book with essays by Professor Samuel and members of the German research group Das Technische Bild—Matthias Bruhn and Margarete Pratschke—as well as scholars Wladimir Velminski, Jan von Brevern, and Juliet Koss. Drawing new connections between the material world and that of mathematical ideas, the publication offers not only a rare glimpse at the artifactual terrain and graphic methodologies of Benoît Mandelbrot and his contemporaries but also investigates the role of scientific imagery in visual thinking across diverse disciplines. Published with Yale University Press (October 2012, paper, 160 color and b/w illustrations, 172 pages), it will be available for $40 in the BGC gallery and through the Web site (bgc.bard.edu).
I guess those of us who can’t attend will be able to enjoy the experience vicariously through the catalogue.
ETA Sept. 18, 2012: I knew Mandelbrot’s name was wrong somewhere in here. Sadly, I didn’t double check the headline till now.
