Thanks to the Science Media Centre of Canada for the notice about this upcoming workshop for science writers, (from the Data Analysis and Visualization Tools for Science Writers page on eventbrite.com), Note: There is a fee of $125 (I assume this is US currency) and a limited number of discounts are available (keep reading either here or on the event page for details about the discounts),
[downloaded from https://www.eventbrite.com/e/data-analysis-and-visualization-tools-for-science-writers-tickets-692049688247]
Also from the event page,
This workshop will focus on reporting & producing data stories about science topics, highlighting free tools for analysis & visualization.
Date and time
Tuesday, October 31 · 12:30 – 2pm PDT
Location
Online
Refund Policy
Contact the organizer to request a refund.Eventbrite’s fee is nonrefundable.
About this event
1 hour 30 minutes Mobile eTicket
Science writers are used to encountering data, whether we’re reading through dense scientific papers or trying to figure out what a statistic means for our readers. But sometimes, datasets themselves can be sources for stories—and they have led to some of the most widely read science stories of the last few years, from El Pais’ visualization of coronavirus spread to ProPublica’s investigation of burning sugar cane. Datasets can help us make complex topics accessible, visualize patterns from research, or even investigate instances of wrongdoing.
A science writer interested in pursuing stories like these could find a wide variety of resources to help them get started on a data project. But the growing data journalism field can be overwhelming: you might not be sure how to pick an initial project, which online course to try, which tools to use, or whether you need to learn how to code first. (Spoiler alert: you don’t!)
This 90-minute hands-on workshop from The Open Notebook, building on the instructor’s TON article about this topic [TON = The Open Notebook], will provide a crash course in data reporting basics. It’s designed for science writers who are interested in pursuing data stories but aren’t quite sure how to get started, and for editors who are interested in working with writers on these stories.
You’ll get an introduction to all of the steps of reporting and producing a data story, from finding story ideas to editing and fact-checking. The workshop will include an interactive tutorial showcasing two common tools that you can start using immediately.
You will learn how to:
Recognize potential data stories on your beat Search for public datasets that you can use Use free tools for data analysis and visualization Work with a data team or independently as a freelancer Make your data stories accessible
The workshop will be recorded and made available to registered participants for three months following the workshop.
Instructor
Betsy Ladyzhets is an independent science, health, and data journalist focused on COVID-19 and the future of public health. She runs the COVID-19 Data Dispatch, a publication that provides news, resources, and original reporting on COVID-19 data. Recently, she was a journalism fellow at MuckRock, where she contributed to award-winning COVID-19 investigations. She also previously managed the Science & Health vertical at Stacker and volunteered at the COVID Tracking Project. Her freelance work has appeared in Science News, The Atlantic, STAT, FiveThirtyEight, MIT Technology Review, and other national publications.
Registration Fee
The registration fee is $125.
About our discounted rates: Our goal at The Open Notebook is to support the advancement of science journalists around the world. In particular, we want to ensure that the resources we provide are accessible to those who have experienced higher-than-average barriers to entry in our field. A limited number of discounted slots are available on a first-come, first-served basis to individuals who are members of communities that have historically been underrepresented in science journalism or whose economic circumstances would make the full cost of the workshops a financial strain. To use this discount, add the promo code TON_70DISCOUNT for a 70 percent discount. (The promo code box is above the workshops listing on the sign-up page.)
The Open Notebook is a 501(c)(3) non-profit organization that is widely regarded as the leading online source of training and educational materials for journalists who cover science. We are dedicated to fostering a supportive, diverse, and inclusive global community that enables reporters and editors who cover science to learn and thrive. Through our comprehensive library of articles on the craft of science journalism and our extensive training and mentoring programs, we empower journalists at all experience levels, around the world, to tell impactful, engaging stories about science.
…
Why We’re Here
At no other time in human history has the meaning of what constitutes a fact—a valid piece of knowledge—been more at risk than it is today. Journalists’ ability to report stories about science clearly, accurately, and engagingly has never been more critical for public understanding of science and for a well-functioning democracy. Journalists who cover science play a crucial and demanding role in society—they must not only explain the newest advances in scientific research, but also provide critical context and analysis on issues ranging from climate change to infectious disease to artificial intelligence; shed light on the human beings behind the research; and serve as watchdogs to help ensure the continued freedom and integrity of the scientific enterprise.
To fulfill such a role takes skill. And the skills that science journalists need are endangered. Only a fraction of working science journalists are trained in formal journalism programs. And with the shrinking number of traditional staff jobs available, science journalism is fast moving toward a “gig economy” that relies on freelancers to produce work once done by staffers. One effect of that shift is that fewer journalists have the opportunity to master skills through the natural mentoring that takes place in newsrooms. In addition, science journalists who are from historically underrepresented communities face formidable barriers to entry and participation in the field. The Open Notebook is dedicated to helping journalists cultivate fundamental skills necessary for covering science and to helping foster a more inclusive community of voices covering science.
What We Do
Since The Open Notebook was founded in 2010, more than a million people from around the world have visited the site. Thousands of journalists have taken part in our courses, workshops, and mentoring programs. Below is a summary of our major programs.
I have two news releases about this reseach, one from March 2023 focused on the technology and one from May 2023 focused on the graffiti.
Simon Fraser University (SFU) and the technology
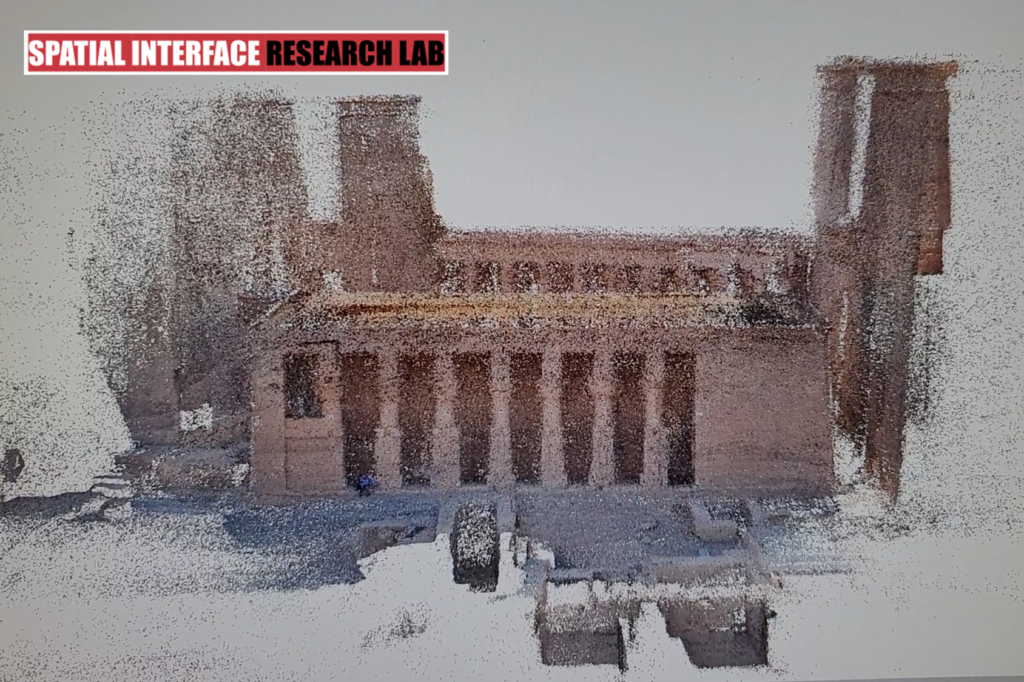
While this looks like an impressionist painting (to me), I believe it’s a still from the spatial reality capture of the temple the researchers were studying,
Photo Credit: Simon Fraser University
A March 30, 2023 news item on phys.org announces the latest technology for research on Egyptian graffiti (Note: A link has been removed),
Simon Fraser University [SFU; Canada] researchers are learning more about ancient graffiti—and their intriguing comparisons to modern graffiti—as they produce a state-of-the-art 3D recording of the Temple of Isis in Philae, Egypt.
Working with the University of Ottawa, the researchers published their early findings in Egyptian Archaeology and have returned to Philae to advance the project.
“It’s fascinating because there are similarities with today’s graffiti,” says SFU geography professor Nick Hedley, co-investigator of the project. “The iconic architecture of ancient Egypt was built by those in positions of power and wealth, but the graffiti records the voices and activities of everybody else. The building acts like a giant sponge or notepad for generations of people from different cultures for over 2,000 years.”
As an expert in spatial reality capture, Hedley leads the team’s innovative visualization efforts, documenting the graffiti, their architectural context, and the spaces they are found in using advanced methods like photogrammetry, raking light, and laser scanning. “I’m recording reality in three-dimensions — the dimensionality in which it exists,” he explains.
With hundreds if not thousands of graffiti, some carved less than a millimeter deep on the temple’s columns, walls, and roof, precision is essential.
Typically, the graffiti would be recorded through a series of photographs — a step above hand-drawn documents — allowing researchers to take pieces of the site away and continue working.
Sabrina Higgins, an SFU archaeologist and project co-investigator, says photographs and two-dimensional plans do not allow the field site to be viewed as a dynamic, multi-layered, and evolving space. “The techniques we are applying to the project will completely change how the graffiti, and the temple, can be studied,” she says.
Hedley is moving beyond basic two-dimensional imaging to create a cutting-edge three-dimensional recording of the temple’s entire surface. This will allow the interior and exterior of the temple, and the graffiti, to be viewed and studied at otherwise impossible viewpoints, from virtually anywhere— without compromising detail.
This three-dimensional visualization will also enable researchers to study the relationship between a figural graffito, any graffiti that surrounds it, and its location in relation to the structure of temple architecture.
While this is transformative for viewing and studying the temple and its inscriptions, Hedley points to the big-picture potential of applying spatial reality capture technology to the field of archaeology, and beyond.
“Though my primary role in this project is to help build the definitive set of digital wall plans for the Mammisi at Philae, I’m also demonstrating how emerging spatial reality capture methods can fundamentally change how we gather and produce data and transform our ability to interpret and analyze these spaces. This is a space to watch!” says Hedley.
Did Hedley mean to make a pun with the comment used to end the news release? I hope so.
University of Ottawa and ancient Egyptian graffiti
Egypt’s Philae temple complex is one of the country’s most famed archeological sites. It is dedicated to the goddess Isis, who was one of the most important deities in ancient Egyptian religion. The main temple is a stunning example of the country’s ancient architecture, with its towering columns and detailed carvings depicting Isis and other gods.
In a world-first,The Philae Temple Graffiti Project research team was able to digitally capture the temple’s graffiti by recording and studying a novel group of neglected evidence for personal religious piety dating to the Graeco-Roman and Late Antique periods. By using advanced recording techniques, like photogrammetry and laser scanning, researchers were able to create a photographic recording of the graffiti, digitizing them in 3D to fully capture their details and surroundings.
“This is not only the first study of circa 400 figural graffiti from one of the most famous temples in Egypt, the Isis temple at Philae,” explains project director Dr. Jitse H.F. Dijkstra, a professor of Classics in the Faculty of Arts at the University of Ottawa (uOttawa). “It is the first to use advanced, cutting-edge methods to record these signs of personal piety in an accurate manner and within their architectural context. This is digital humanities in action.”
Professor Dijkstra collaborates in the project with co-investigators Nicholas Hedley, a geography professor at Simon Fraser University (SFU), Sabrina Higgins, an archaeologist and art historian also at SFU, and Roxanne Bélanger Sarrazin, a uOttawa alumna, now a post-doctoral fellow at the University of Oslo.
Temple walls reveal their messages
The newly available state-of-the-art technology has allowed the team to uncover hundreds of 2,000-year-old figural graffiti (a type of graffito consisting of figures or images rather than symbols or text) on the Isis temple’s walls. They have also been able to study them from vantage points that would otherwise have been difficult to reach.
Today, graffiti are seen as an art form that serves as a means of communication, to mark a name or ‘tag,’ or to leave a reference to one’s presence at a given site. The 2,000-year-old graffiti of ancient civilisations served a similar purpose. The research team has found drawings – some carved only 1mm deep – of feet, animals, deities and other figures meant to express the personal religious piety of the maker in the temple complex.
Using 3D renderings of the interior and exterior of the temple, the team gained detailed knowledge about where the graffiti are found on the walls, and their meaning. Although the majority of the graffiti are intended to ask for divine protection, others were playful gameboards; Old Egyptian temples functioned as a focus of worship and more ephemeral activities.
A first for this UNESCO heritage site, the innovative fieldwork is at the forefront of Egyptian archaeology and digital humanities (which explores human interactions and culture).
“What ancient Egyptian graffiti have in common with modern graffiti is they are left in places not originally foreseen for that purpose,” adds Professor Dijkstra. “The big difference, however, is that ancient Egyptian graffiti were left by individuals at temples in order to receive divine protection forever, which is why we find hundreds of graffiti on every Egyptian temple’s walls.”
The Philae Temple Graffiti Project was initiated in 2016 under the aegis of the Philae Temple Text Project of the Austrian Academy of Sciences and the Swiss Institute for Architectural and Archaeological Research on Ancient Egypt, Cairo. It is funded by the Social Sciences and Humanities Research Council of Canada (SSHRC) and aims to study the figural graffiti from one of the most spectacular temple complexes of Egypt, Philae, in order to better understand the daily practice of the goddess’ worship.
The study’s first findings were published in Egyptian Archeology
Fascinatingly for a project where new technology has been vital, the work has been published in a periodical (Egyptian Archaeology) that is not available online. It is published by the Egypt Exploration Society (EES) which also produces the similarly titled “Journal of Egyptian Archaeology”.
You can purchase the relevant issue of “Egyptian Archaeology” here. The EES describes it as a “… full-colour magazine, reporting on current excavations, surveys and research in Egypt and Sudan, showcasing the work of the EES as well as of other missions and researchers.”
Here’s a citation for the article,
Figures that Matter: Graffiti of the Isis Temple at Philae by Roxanne Bélanger Sarrazin, Jitse Dijkstra, Nicholas Hedley and Sabrina Higgins. Egyptian Archaeology, Spring 2022, [issue no.] 60.
A new project led by Associate Professor Kate McDowell and Assistant Professor Matthew Turk of the School of Information Sciences (iSchool) at the University of Illinois Urbana-Champaign will help libraries tell data stories that connect with their audiences. Their project, “Data Storytelling Toolkit for Librarians,” has received a two-year, $99,330 grant from the Institute of Museum and Library Services (IMLS grant RE-250094-OLS-21), under the Laura Bush 21st Century Librarian Program, which supports innovative research by untenured, tenure-track faculty.
“There are thousands of librarians who are skittish about data but love stories,” explained McDowell, who co-teaches a data storytelling course at the iSchool with Turk. “And there are hundreds of librarians who see data as fundamental, but until those librarians have a language through which to connect with the passions of the thousands who love stories, this movement toward strategic data use in the field of libraries will be stifled, along with the potential collaborative creativity of librarians.”
The data storytelling toolkit will provide a set of easy-to-adapt templates, which librarians can use to move quickly from data to story to storytelling. Librarians will be able to use the toolkit to plug in data they already have and generate data visualization and narrative structure options.
“To give an example, public libraries need to communicate employment impact. In this case, the data story will include who has become employed based on library services, how (journey map showing a visual sequence of steps from job seeking to employment), a structure for the story of an individual’s outcomes, and a strong data visualization strategy for communicating this impact,” said McDowell.
According to the researchers, the toolkit will be clearly defined so that librarians understand the potential for communicating with data but also fully adaptable to each librarian’s setting and to the communication needs inside the organization and with the public. The project will focus on community college and public libraries, with initial collaborators to include Ericson Public Library in Boone, Iowa; Oregon City (OR) Public Library; Moraine Valley Community College in Palos Hills, Illinois; Jackson State Community College in Jackson, Tennessee; and The Urbana Free Library.
McDowell’s storytelling research has involved training collaborations with advancement staff both at the University of Illinois Urbana-Champaign and the University of Illinois system; storytelling consulting work for multiple nonprofits including the 50th anniversary of the statewide Prairie Rivers Network that protects Illinois water; and storytelling lectures for the Consortium of Academic and Research Libraries in Illinois (CARLI). McDowell researches and publishes in the areas of storytelling at work, social justice storytelling, and what library storytelling can teach the information sciences about data storytelling. She holds both an MS and PhD in library and information science from Illinois.
Turk also holds an appointment with the Department of Astronomy in the College of Liberal Arts and Sciences at the University of Illinois. His research focuses on how individuals interact with data and how that data is processed and understood. He is a recipient of the prestigious Gordon and Betty Moore Foundation’s Moore Investigator Award in Data-Driven Discovery. Turk holds a PhD in physics from Stanford University.
Collecting and understanding data is important, but equally important is the ability to tell meaningful stories based on data. Students in the iSchool’s Data Science Storytelling course (IS 590DST) learn data visualization as well as storytelling techniques, a combination that will prove valuable to their employers as they enter the workforce.
The course instructors, Associate Professor and Interim Associate Dean for Academic Affairs Kate McDowell and Assistant Professor Matthew Turk, introduced Data Science Storytelling in fall 2017. The course combines McDowell’s research interests in storytelling practices and applications and Turk’s research interests in data analysis and visualization.
Students in the course learn storytelling concepts, narrative theories, and performance techniques as well as how to develop stories in a collaborative workshop style. They also work with data visualization toolkits, which involves some knowledge of coding.
Ashley Hetrick (MS ’18) took Data Science Storytelling because she wanted “the skills to be able to tell the right story when the time is right for it.” She appreciated the practical approach, which allowed the students to immediately apply the skills they learned, such as developing a story structure and using a pandas DataFrame to support and build a story. Hetrick is using those skills in her current work as assistant director for research data engagement and education at the University of Illinois.
“I combine tools and methods from data science and analytics with storytelling to make sense of my unit’s data and to help researchers make sense of theirs,” she said. “In my experience, few researchers like data for its own sake. They collect, care for, and analyze data because they’re after what all storytellers are after: meaning. They want to find the signal in all of this noise. And they want others to find it too, perhaps long after their own careers are complete. Each dataset is a story and raw material for stories waiting to be told.”
According to Turk, the students who have enrolled in the course have been outstanding, “always finding ways to tell meaningful stories from data.” He hopes they leave the class with an understanding that stories permeate their lives and that shaping the stories they tell others and about others is a responsibility they carry with them.
“One reason that this course means a lot to me is because it gives students the opportunity to really bring together the different threads of study at the iSchool,” Turk said. “It’s a way to combine across levels of technicality, and it gives students permission to take a holistic approach to how they present data.”
I didn’t put much effort into it but did find three other courses on data storytelling, one at the University of Texas (my favourite), one at the University of Toronto, and one (Data Visualization and Storytelling) at the University of British Columbia. The one at the University of British Columbia is available through the business school, the other two are available through information/library science faculties.
Being able to analyze Twitter messages (tweets) in real-time is amazing given what I wrote in this January 16, 2013 posting titled: “Researching tweets (the Twitter kind)” about the US Library of Congress and its attempts to access tweets for scholars,”
At least one of the reasons no one has received access to the tweets is that a single search of the archived (2006- 2010) tweets alone would take 24 hours, [emphases mine] …
So, bravo to the researchers at the University of Vermont (UVM). A July 16, 2021 news item on ScienceDaily makes the announcement,
For thousands of years, people looked into the night sky with their naked eyes — and told stories about the few visible stars. Then we invented telescopes. In 1840, the philosopher Thomas Carlyle claimed that “the history of the world is but the biography of great men.” Then we started posting on Twitter.
Now scientists have invented an instrument to peer deeply into the billions and billions of posts made on Twitter since 2008 — and have begun to uncover the vast galaxy of stories that they contain.
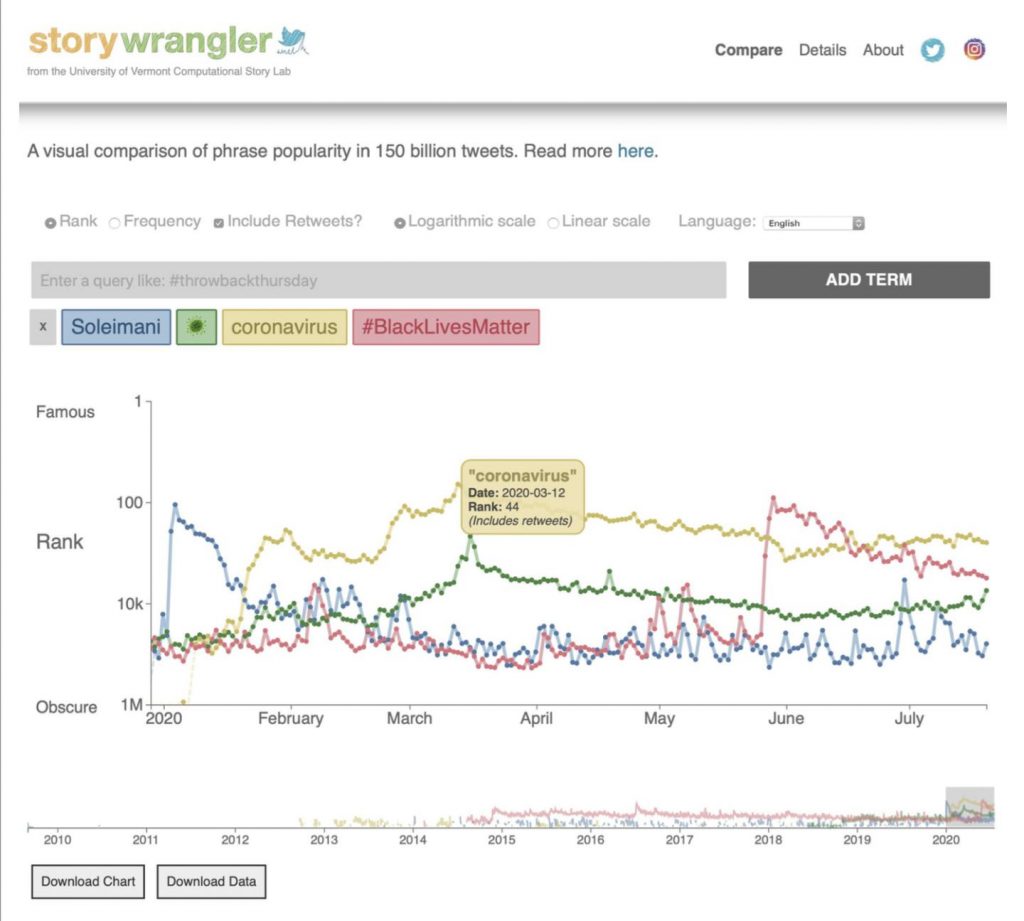
Caption: UVM scientists have invented a new tool: the Storywrangler. It visualizes the use of billions of words, hashtags and emoji posted on Twitter. In this example from the tool’s online viewer, three global events from 2020 are highlighted: the death of Iranian general Qasem Soleimani; the beginning of the COVID-19 pandemic; and the Black Lives Matter protests following the murder of George Floyd by Minneapolis police. The new research was published in the journal Science Advances. Credit: UVM
A July 15, 2021 UVM news release (also on EurekAlert but published on July 16, 2021) by Joshua Brown, which originated the news item, provides more detail abut the work,
“We call it the Storywrangler,” says Thayer Alshaabi, a doctoral student at the University of Vermont who co-led the new research. “It’s like a telescope to look — in real time — at all this data that people share on social media. We hope people will use it themselves, in the same way you might look up at the stars and ask your own questions.”
The new tool can give an unprecedented, minute-by-minute view of popularity, from rising political movements to box office flops; from the staggering success of K-pop to signals of emerging new diseases.
The story of the Storywrangler — a curation and analysis of over 150 billion tweets–and some of its key findings were published on July 16 [2021] in the journal Science Advances.
EXPRESSIONS OF THE MANY
The team of eight scientists who invented Storywrangler — from the University of Vermont, Charles River Analytics, and MassMutual Data Science [emphasis mine]– gather about ten percent of all the tweets made every day, around the globe. For each day, they break these tweets into single bits, as well as pairs and triplets, generating frequencies from more than a trillion words, hashtags, handles, symbols and emoji, like “Super Bowl,” “Black Lives Matter,” “gravitational waves,” “#metoo,” “coronavirus,” and “keto diet.”
“This is the first visualization tool that allows you to look at one-, two-, and three-word phrases, across 150 different languages [emphasis mine], from the inception of Twitter to the present,” says Jane Adams, a co-author on the new study who recently finished a three-year position as a data-visualization artist-in-residence at UVM’s Complex Systems Center.
The online tool, powered by UVM’s supercomputer at the Vermont Advanced Computing Core, provides a powerful lens for viewing and analyzing the rise and fall of words, ideas, and stories each day among people around the world. “It’s important because it shows major discourses as they’re happening,” Adams says. “It’s quantifying collective attention.” Though Twitter does not represent the whole of humanity, it is used by a very large and diverse group of people, which means that it “encodes popularity and spreading,” the scientists write, giving a novel view of discourse not just of famous people, like political figures and celebrities, but also the daily “expressions of the many,” the team notes.
In one striking test of the vast dataset on the Storywrangler, the team showed that it could be used to potentially predict political and financial turmoil. They examined the percent change in the use of the words “rebellion” and “crackdown” in various regions of the world. They found that the rise and fall of these terms was significantly associated with change in a well-established index of geopolitical risk for those same places.
WHAT’S HAPPENING?
The global story now being written on social media brings billions of voices — commenting and sharing, complaining and attacking — and, in all cases, recording — about world wars, weird cats, political movements, new music, what’s for dinner, deadly diseases, favorite soccer stars, religious hopes and dirty jokes.
“The Storywrangler gives us a data-driven way to index what regular people are talking about in everyday conversations, not just what reporters or authors have chosen; it’s not just the educated or the wealthy or cultural elites,” says applied mathematician Chris Danforth, a professor at the University of Vermont who co-led the creation of the StoryWrangler with his colleague Peter Dodds. Together, they run UVM’s Computational Story Lab.
“This is part of the evolution of science,” says Dodds, an expert on complex systems and professor in UVM’s Department of Computer Science. “This tool can enable new approaches in journalism, powerful ways to look at natural language processing, and the development of computational history.”
How much a few powerful people shape the course of events has been debated for centuries. But, certainly, if we knew what every peasant, soldier, shopkeeper, nurse, and teenager was saying during the French Revolution, we’d have a richly different set of stories about the rise and reign of Napoleon. “Here’s the deep question,” says Dodds, “what happened? Like, what actually happened?”
GLOBAL SENSOR
The UVM team, with support from the National Science Foundation [emphasis mine], is using Twitter to demonstrate how chatter on distributed social media can act as a kind of global sensor system — of what happened, how people reacted, and what might come next. But other social media streams, from Reddit to 4chan to Weibo, could, in theory, also be used to feed Storywrangler or similar devices: tracing the reaction to major news events and natural disasters; following the fame and fate of political leaders and sports stars; and opening a view of casual conversation that can provide insights into dynamics ranging from racism to employment, emerging health threats to new memes.
In the new Science Advances study, the team presents a sample from the Storywrangler’s online viewer, with three global events highlighted: the death of Iranian general Qasem Soleimani; the beginning of the COVID-19 pandemic; and the Black Lives Matter protests following the murder of George Floyd by Minneapolis police. The Storywrangler dataset records a sudden spike of tweets and retweets using the term “Soleimani” on January 3, 2020, when the United States assassinated the general; the strong rise of “coronavirus” and the virus emoji over the spring of 2020 as the disease spread; and a burst of use of the hashtag “#BlackLivesMatter” on and after May 25, 2020, the day George Floyd was murdered.
“There’s a hashtag that’s being invented while I’m talking right now,” says UVM’s Chris Danforth. “We didn’t know to look for that yesterday, but it will show up in the data and become part of the story.”
I’m glad to see they are looking at phrases in many different languages. Although I do experience some hesitation when I consider the two companies involved in this research with the University of Vermont.
Charles River Analytics and MassMutual Data Science would not have been my first guess for corporate involvement but on re-examining the subhead and noting this: “potentially predict political and financial turmoil”, they make perfect sense. Charles River Analytics provides “Solutions to serve the warfighter …”, i.e., soldiers/the military, and MassMutual is an insurance company with a dedicated ‘data science space’ (from the MassMutual Explore Careers Data Science webpage),
What are some key projects that the Data Science team works on?
Data science works with stakeholders throughout the enterprise to automate or support decision making when outcomes are unknown. We help determine the prospective clients that MassMutual should market to, the risk associated with life insurance applicants, and which bonds MassMutual should invest in. [emphases mine]
Of course. The military and financial services. Delightfully, this research is at least partially (mostly?) funded on the public dime, the US National Science Foundation.
Interactive data visualization for children who want to learn about the universe in the form of a book was published by Penguin Books as “I am a book. I am a portal to the universe.” was first published in 2020. As of April 2021, it has crossed the Atlantic Ocean occasioning an April 16, 2021 article by Mark Wilson for Fast Company (Note: Links have been removed),
…
… A collaboration between data-centric designer Stefanie Posavec and data journalist Miriam Quick, …
“The pared-back aesthetic is due to the book’s core concept. The whole book, even the endnotes and acknowledgements, is written in the first person, in the book’s own voice. [emphasis mine] It developed its own rather theatrical character as we worked on it,” says Posavec. “The book speaks directly to the reader using whatever materials it has at its disposal to communicate the wonders of our universe. In the purest sense, that means the book’s paper and binding, its typeface and its CMYK [cyan, magenta, yellow, black] ink, or, as the book would call them, its ‘superpowers.’” [emphases mine]
It’s hard to explain without actually experiencing it. Which is exactly why it’s so much fun. For instance, at one moment, the book asks you to put it on your head [emphasis mine] and take it off. That difference in weight you feel? That’s how much lighter you are on the top of a mountain than at sea level, the book explains, because of the difference in gravity at different altitudes. …
I recommend reading Wilson’s April 16, 2021 article in its entirety if you have the time as it is peppered with images, GIFs, and illustrative stories.
“Typography and design combine thrillingly to form something that is
eye-opening in
every sense”
— Financial Times
Hello. I am a book. But I’m also a portal to the universe.
I have 112 pages, measuring 20cm high and wide. I weigh 450g. And I have the power to show you the wonders of the world.
I’m different to any other book around today. I am not a book of infographics. I’m an informative, interactive experience, in which the data can be touched, felt and understood, with every measurement represented on a 1:1 scale. How long is an anteater’s tongue? How tiny is the DNA in your cells? How fast is gold mined? How loud is the sun? And how many stars have been born and exploded in the time you’ve taken to read this sentence?
…
There is a September 2020 Conversations with Data podcast: Episode 13 (hosted by Tara Kelly on Spotify) featuring Stefanie Posavec (data-centric designer) and Miriam Quick (data journalist) discussing their book.
At long last, the end is in sight! This last part is mostly a collection of items that don’t fit elsewhere or could have fit elsewhere but that particular part was already overstuffed.
Podcasting science for the people
March 2009 was the birth date for a podcast, then called Skeptically Speaking and now known as Science for the People (Wikipedia entry). Here’s more from the Science for the People About webpage,
Science for the People is a long-format interview podcast that explores the connections between science, popular culture, history, and public policy, to help listeners understand the evidence and arguments behind what’s in the news and on the shelves.
Every week, our hosts sit down with science researchers, writers, authors, journalists, and experts to discuss science from the past, the science that affects our lives today, and how science might change our future.
THE TEAM
Rachelle Saunders: Producer & Host
I love to learn new things, and say the word “fascinating” way too much. I like to talk about intersections and how science and critical thinking intersect with everyday life, politics, history, and culture. By day I’m a web developer, and I definitely listen to way too many podcasts.
Created in 2007 with the generous funding of the Social Sciences and Humanities Research Council of Canada Strategic Knowledge Cluster grant, Situating Science is a seven-year project promoting communication and collaboration among humanists and social scientists that are engaged in the study of science and technology.
…
You can find out more about Situating Science’s final days in my August 16, 2013 posting where I included a lot of information about one of their last events titled, “Science and Society 2013 Symposium; Emerging Agendas for Citizens and the Sciences.”
…
The “think-tank” will dovetail nicely with a special symposium in Ottawa on Science and Society Oct. 21-23. For this symposium, the Cluster is partnering with the Institute for Science, Society and Policy to bring together scholars from various disciplines, public servants and policy workers to discuss key issues at the intersection of science and society. [emphasis mine] The discussions will be compiled in a document to be shared with stakeholders and the wider public.
The team will continue to seek support and partnerships for projects within the scope of its objectives. Among our top priorities are a partnership to explore sciences, technologies and their publics as well as new partnerships to build upon exchanges between scholars and institutions in India, Singapore and Canada.
…
The Situating Science folks did attempt to carry on the organization’s work by rebranding the organization to call it the Canadian Consortium for Situating Science and Technology (CCSST). It seems to have been a short-lived volunteer effort.
Meanwhile, the special symposium held in October 2013 appears to have been the springboard for another SSHRC funded multi-year initiative, this time focused on science collaborations between Canada, India, and Singapore, Cosmopolitanism and the Local in Science and Nature from 2014 – 2017. Despite their sunset year having been in 2017, their homepage boasts news about a 2020 Congress and their Twitter feed is still active. Harking back, here’s what the project was designed to do, from the About Us page,
Welcome to our three year project that will establish a research network on “Cosmopolitanism” in science. It closely examines the actual types of negotiations that go into the making of science and its culture within an increasingly globalized landscape. This partnership is both about “cosmopolitanism and the local” and is, at the same time, cosmopolitan and local.
Anyone who reads this blog with any frequency will know that I often comment on the fact that when organizations such as the Council of Canadian Academies bring in experts from other parts of the world, they are almost always from the US or Europe. So, I was delighted to discover the Cosmopolitanism project and featured it in a February 19, 2015 posting.
Expose a hitherto largely Eurocentric scholarly community in Canada to widening international perspectives and methods,
Build on past successes at border-crossings and exchanges between the participants,
Facilitate a much needed nation-wide organization and exchange amongst Indian and South East Asian scholars, in concert with their Canadian counterparts, by integrating into an international network,
Open up new perspectives on the genesis and place of globalized science, and thereby
Offer alternative ways to conceptualize and engage globalization itself, and especially the globalization of knowledge and science.
Bring the managerial team together for joint discussion, research exchange, leveraging and planning – all in the aid of laying the grounds of a sustainable partnership
Eco Art (also known as ecological art or environmental art)
I’m of two minds as to whether I should have tried to stuff this into the art/sci subsection in part 2. On balance, I decided that this merited its own section and that part 2 was already overstuffed.
Let’s start in Newfoundland and Labrador with Marlene Creates (pronounced Kreets), here’s more about her from her website’s bio webpage,
Marlene Creates (pronounced “Kreets”) is an environmental artist and poet who works with photography, video, scientific and vernacular knowledge, walking and collaborative site-specific performance in the six-acre patch of boreal forest in Portugal Cove, Newfoundland and Labrador, Canada, where she lives.
…
For almost 40 years her work has been an exploration of the relationship between human experience, memory, language and the land, and the impact they have on each other. …
…
Currently her work is focused on the six acres of boreal forest where she lives in a ‘relational aesthetic’ to the land. This oeuvre includes Water Flowing to the Sea Captured at the Speed of Light, Blast Hole Pond River, Newfoundland 2002–2003, and several ongoing projects:
…
Marlene Creates received a Governor General’s Award in Visual and Media Arts for “Lifetime Artistic Achievement” in 2019. …
An October 1, 2018 article by Yasmin Nurming-Por for Canadian Art magazine features 10 artists who focus on environmental and/or land art themes,
As part of her 2016 master’s thesis exhibition, Fredericton [New Brunswick] artist Gillian Dykeman presented the video Dispatches from the Feminist Utopian Future within a larger installation that imagined various canonical earthworks from the perspective of the future. It’s a project that addresses the inherent sense of timelessness in these massive interventions on the natural landscape from the perspective of contemporary land politics. … she proposes a kind of interaction with the invasive and often colonial gestures of modernist Land art, one that imagines a different future for these earthworks, where they are treated as alien in a landscape and as beacons from a feminist future.
…
A video trailer featuring “DISPATCHES FROM THE FEMINIST UTOPIAN FUTURE” (from Dykeman’s website archive page featuring the show,
If you have the time, I recommend reading the article in its entirety.
Oddly, I did not expect Vancouver to have such an active eco arts focus. The City of Vancouver Parks Board maintains an Environmental Art webpage on its site listing a number of current and past projects.
I cannot find the date for when this Parks Board initiative started but I did find a document produced prior to a Spring 2006 Arts & Ecology think tank held in Vancouver under the auspices of the Canada Council for the Arts, the Canadian Commission for UNESCO, the Vancouver Foundation, and the Royal Society for the Encouragement of the Arts, Manufactures and Commerce (London UK).
In all likelihood, Vancouver Park Board’s Environmental Art webpage was produced after 2006.
I imagine the document and the think tank session helped to anchor any then current eco art projects and encouraged more projects.
While its early days were in 2008, EartHand Gleaners (Vancouver-based) wasn’t formally founded as an arts non-for-profit organization until 2013. You can find out more about them and their projects here.
Eco Art has been around for decades according to the eco art think tank document but it does seemed to have gained momentum here in Canada over the last decade.
Photography and the Natural Sciences and Engineering Research Council of Canada (NSERC)
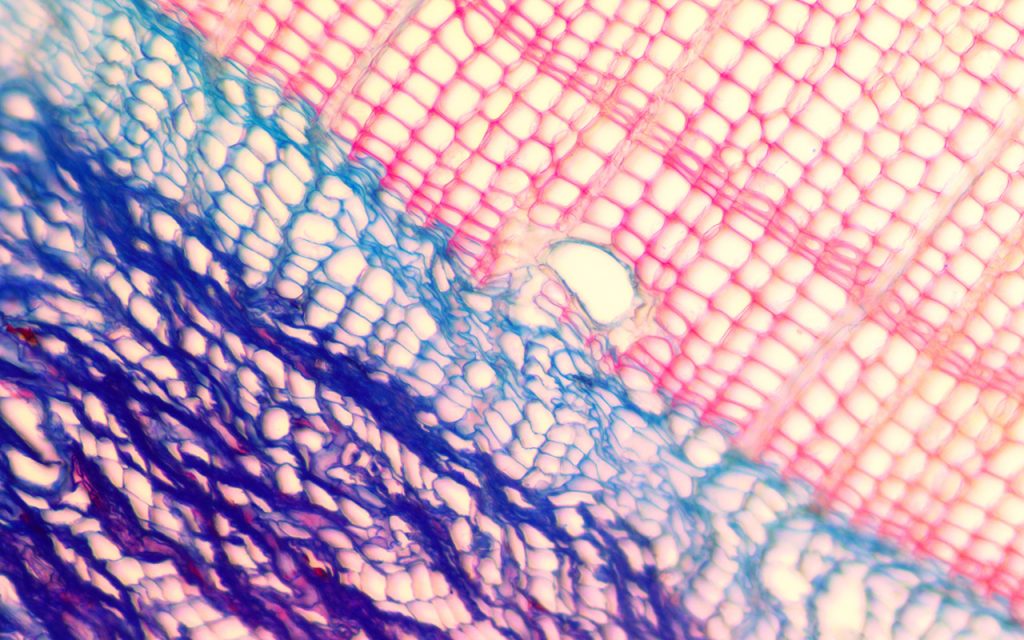
Exploring the jack pine tight knit family tree. Credit: Dana Harris Brock University (2018)
Pictured are developing phloem, cambial, and xylem cells (blue), and mature xylem cells (red), in the outermost portion of a jack pine tree. This research aims to identify the influences of climate on the cellular development of the species at its northern limit in Yellowknife, NT. The differences in these cell formations is what creates the annual tree ring boundary.
Science Exposed is a photography contest for scientists which has been run since 2016 (assuming the Past Winners archive is a good indicator for the programme’s starting year).
The 2020 competition recently closed but public voting should start soon. It’s nice to see that NSERC is now making efforts to engage members of the general public rather than focusing its efforts solely on children. The UK’s ASPIRES project seems to support the idea that adults need to be more fully engaged with STEM (science, technology, engineering, and mathematics) efforts as it found that children’s attitudes toward science are strongly influenced by their parents’ and relatives’ attitudes.(See my January 31, 2012 posting.)
Ingenious, the book and Ingenium, the science museums
To celebrate Canada’s 150th anniversary in 2017, then Governor General David Johnston and Tom Jenkins (Chair of the board for Open Text and former Chair of the federal committee overseeing the ‘Review of Federal Support to R&’D [see my October 21, 2011 posting about the resulting report]) wrote a boo about Canada’s inventors and inventions.
Johnston and Jenkins jaunted around the country launching their book (I have more about their June 1, 2017 Vancouver visit in a May 30, 2017 posting; scroll down about 60% of the way]).
The book’s full title, “Ingenious: How Canadian Innovators Made the World Smarter, Smaller, Kinder, Safer, Healthier, Wealthier and Happier ” outlines their thesis neatly.
Not all that long after the book was launched, there was a name change (thankfully) for the Canada Science and Technology Museums Corporation (CSTMC). It is now known as Ingenium (covered in my August 10, 2017 posting).
The reason that name change was such a relief (for those who don’t know) is that the corporation included three national science museums: Canada Aviation and Space Museum, Canada Agriculture and Food Museum, and (wait for it) Canada Science and Technology Museum. On the list of confusing names, this ranks very high for me. Again, I give thanks for the change from CSTMC to Ingenium, leaving the name for the museum alone.
2017 was also the year that the newly refurbished Canada Science and Technology Museum was reopened after more than three years (see my June 23, 2017 posting about the November 2017 reopening and my June 12, 2015 posting for more information about the situation that led to the closure).
A Saskatchewan lab, Convergence, Order of Canada, Year of Science, Animated Mathematics, a graphic novel, and new media
Since this section is jampacked, I’m using subheads.
Saskatchewan
Dr. Brian Eameshosts an artist-in-residence,Jean-Sebastien (JS) Gauthier at the University of Saskatchewan’s College of Medicine Eames Lab. A February 16, 2018 posting here featured their first collaboration together. It covered evolutionary biology, the synchrotron (Canadian Light Source [CLS]) in Saskatoon, and the ‘ins and outs’ of a collaboration between a scientist an artist. Presumably the art-in-residence position indicates that first collaboration went very well.
In January 2020, Brian kindly gave me an update on their current projects. Jean-Sebastin successfully coded an interactive piece for an exhibit at the 2019 Nuit Blanche Saskatoon event using Connect (Xbox). More recently, he got a VR [virtual reality] helmet for an upcoming project or two.
Our Glass is a work of interactive SciArt co-created by artist JS Gauthier and biologist Dr Brian F. Eames. It uses cutting-edge 3D microscopic images produced for artistic purposes at the Canadian Light Source, Canada’s only synchrotron facility. Our Glass engages viewers of all ages to peer within an hourglass showing how embryonic development compares among animals with whom we share a close genetic heritage.
Eames also mentioned they were hoping to hold an international SciArt Symposium at the University of Saskatchewan in 2021.
Convergence
Dr. Cristian Zaelzer-Perez, an instructor at Concordia University (Montreal; read this November 20, 2019 Concordia news release by Kelsey Rolfe for more about his work and awards), in 2016 founded the Convergence Initiative, a not-for-profit organization that encourages interdisciplinary neuroscience and art collaborations.
Cat Lau’s December 23, 2019 posting for the Science Borealis blog provides insight into Zaelzer-Perez’s relationship to science and art,
…
Cristian: I have had a relationship with art and science ever since I have had memory. As a child, I loved to do classifications, from grouping different flowers to collecting leaves by their shapes. At the same time, I really loved to draw them and for me, both things never looked different; they (art and science) have always worked together.
I started as a graphic designer, but the pursuit to learn about nature was never dead. At some point, I knew I wanted to go back to school to do research, to explore and learn new things. I started studying medical technologies, then molecular biology and then jumped into a PhD. At that point, my life as a graphic designer slipped down, because of the focus you have to give to the discipline. It seemed like every time I tried to dedicate myself to one thing, I would find myself doing the other thing a couple years later.
I came to Montreal to do my post-doc, but I had trouble publishing, which became problematic in getting a career. I was still loving what I was doing, but not seeing a future in that. Once again, art came back into my life and at the same time I saw that science was becoming really hard to understand and scientists were not doing much to bridge the gap.
For a writer of children’s science books, an appointment to the Order of Canada is a singular honour. I cannot recall a children’s science book writer previous to Shar Levine being appointed as a Member of the Order of Canada. Known as ‘The Science Lady‘, Levine was appointed in 2016. Here’s more from her Wikipedia entry, Note: Links have been removed,
Shar Levine (born 1953) is an award-winning, best selling Canadian children’s author, and designer.
Shar has written over 70 books and book/kits, primarily on hands-on science for children. For her work in Science literacy and Science promotion, Shar has been appointed to the 2016 Order of Canada. In 2015, she was recognized by the University of Alberta and received their Alumni Honour Award. Levine, and her co-author, Leslie Johnstone, were co-recipients of the Eve Savory Award for Science Communication from the BC Innovation Council (2006) and their book, Backyard Science, was a finalist for the Subaru Award, (hands on activity) from the American Association for the Advancement of Science, Science Books and Films (2005). The Ultimate Guide to Your Microscope was a finalist-2008 American Association for the Advancement of Science/Subaru Science Books and Films Prize Hands -On Science/Activity Books.
…
To get a sense of what an appointment to the Order of Canada means, here’s a description from the government of Canada website,
The Order of Canada is how our country honours people who make extraordinary contributions to the nation.
Since its creation in 1967—Canada’s centennial year—more than 7 000 people from all sectors of society have been invested into the Order. The contributions of these trailblazers are varied, yet they have all enriched the lives of others and made a difference to this country. Their grit and passion inspire us, teach us and show us the way forward. They exemplify the Order’s motto: DESIDERANTES MELIOREM PATRIAM (“They desire a better country”).
…
Year of Science in British Columbia
In the Fall of 2010, the British Columbia provincial government announced a Year of Science (coinciding with the school year) . Originally, it was supposed to be a provincial government-wide initiative but the idea percolated through any number of processes and emerged as a year dedicated to science education for youth (according to the idea’s originator, Moira Stilwell who was then a Member of the Legislative Assembly [MLA]’ I spoke with her sometime in 2010 or 2011).
As the ‘year’ drew to a close, there was a finale ($1.1M in funding), which was featured here in a July 6, 2011 posting.
The larger portion of the money ($1M) was awarded to Science World while $100,000 ($0.1 M) was given to the Pacific Institute of Mathematical Sciences To my knowledge there have been no followup announcements about how the money was used.
Animation and mathematics
In Toronto, mathematician Dr. Karan Singh enjoyed a flurry of interest due to his association with animator Chris Landreth and their Academy Award (Oscar) Winning 2004 animated film, Ryan. They have continued to work together as members of the Dynamic Graphics Project (DGP) Lab at the University of Toronto. Theirs is not the only Oscar winning work to emerge from one or more of the members of the lab. Jos Stam, DGP graduate and adjunct professor won his third in 2019.
A graphic novel and medical promise
An academic at Simon Fraser University since 2015, Coleman Nye worked with three other women to produce a graphic novel about medical dilemmas in a genre described as’ ethno-fiction’.
Lissa: A Story about Medical Promise, Friendship, and Revolution (2017) by Sherine Hamdy and Coleman Nye, two anthropologists and Art by Sarula Bao and Caroline Brewer, two artists.
As young girls in Cairo, Anna and Layla strike up an unlikely friendship that crosses class, cultural, and religious divides. Years later, Anna learns that she may carry the hereditary cancer gene responsible for her mother’s death. Meanwhile, Layla’s family is faced with a difficult decision about kidney transplantation. Their friendship is put to the test when these medical crises reveal stark differences in their perspectives…until revolutionary unrest in Egypt changes their lives forever.
The first book in a new series [ethnoGRAPIC; a series of graphic novels from the University of Toronto Press], Lissa brings anthropological research to life in comic form, combining scholarly insights and accessible, visually-rich storytelling to foster greater understanding of global politics, inequalities, and solidarity.
I hope to write more about this graphic novel in a future posting.
New Media
I don’t know if this could be described as a movement yet but it’s certainly an interesting minor development. Two new media centres have hosted, in the last four years, art/sci projects and/or workshops. It’s unexpected given this definition from the Wikipedia entry for New Media (Note: Links have been removed),
New media are forms of media that are computational and rely on computers for redistribution. Some examples of new media are computer animations, computer games, human-computer interfaces, interactive computer installations, websites, and virtual worlds.[1][2]
In Manitoba, the Video Pool Media Arts Centre hosted a February 2016 workshop Biology as a New Art Medium: Workshop with Marta De Menezes. De Menezes, an artist from Portugal, gave workshops and talks in both Winnipeg (Manitoba) and Toronto (Ontario). Here’s a description for the one in Winnipeg,
This workshop aims to explore the multiple possibilities of artistic approaches that can be developed in relation to Art and Microbiology in a DIY situation. A special emphasis will be placed on the development of collaborative art and microbiology projects where the artist has to learn some biological research skills in order to create the artwork. The course will consist of a series of intense experimental sessions that will give raise to discussions on the artistic, aesthetic and ethical issues raised by the art and the science involved. Handling these materials and organisms will provoke a reflection on the theoretical issues involved and the course will provide background information on the current diversity of artistic discourses centred on biological sciences, as well a forum for debate.
…
VIVO Media Arts Centre in Vancouver hosted the Invasive Systems in 2019. From the exhibition page,
Picture this – a world where AI invades human creativity, bacteria invade our brains, and invisible technological signals penetrate all natural environments. Where invasive species from plants to humans transform spaces where they don’t belong, technology infiltrates every aspect of our daily lives, and the waste of human inventions ravages our natural environments.
…
This weekend festival includes an art-science exhibition [emphasis mine], a hands-on workshop (Sat, separate registration required), and guided discussions and tours by the curator (Sat/Sun). It will showcase collaborative works by three artist/scientist pairs, and independent works by six artists. Opening reception will be on Friday, November 8 starting at 7pm; curator’s remarks and performance by Edzi’u at 7:30pm and 9pm.
New Westminster’s (British Columbia) New Media Gallery recently hosted an exhibition, ‘winds‘ from June 20 – September 29, 2019 that could be described as an art/sci exhibition,
Landscape and weather have long shared an intimate connection with the arts. Each of the works here is a landscape: captured, interpreted and presented through a range of technologies. The four artists in this exhibition have taken, as their material process, the movement of wind through physical space & time. They explore how our perception and understanding of landscape can be interpreted through technology.
These works have been created by what might be understood as a sort of scientific method or process that involves collecting data, acute observation, controlled experiments and the incorporation of measurements and technologies that control or collect motion, pressure, sound, pattern and the like. …
Council of Canadian Academies, Publishing, and Open Access
Established in 2005, the Council of Canadian Academies (CCA) (Wikipedia entry) is tasked by various departments and agencies to answer their queries about science issues that could affect the populace and/or the government. In 2014, the CCA published a report titled, Science Culture: Where Canada Stands. It was in response to the Canada Science and Technology Museums Corporation (now called Ingenium), Industry Canada, and Natural Resources Canada and their joint request that the CCA conduct an in-depth, independent assessment to investigate the state of Canada’s science culture.
I gave a pretty extensive analysis of the report, which I delivered in four parts: Part 1, Part 2 (a), Part 2 (b), and Part 3. In brief, the term ‘science culture’ seems to be specifically, i.e., it’s not used elsewhere in the world (that we know of), Canadian. We have lots to be proud of. I was a little disappointed by the lack of culture (arts) producers on the expert panel and, as usual, I bemoaned the fact that the international community included as reviewers, members of the panel, and as points for comparison were drawn from the usual suspects (US, UK, or somewhere in northern Europe).
Science publishing in Canada took a bit of a turn in 2010, when the country’s largest science publisher, NRC (National Research Council) Research Publisher was cut loose from the government and spun out into the private, *not-for-profit publisher*, Canadian Science Publishing (CSP). From the CSP Wikipedia entry,
Since 2010, Canadian Science Publishing has acquired five new journals:
Canadian Science Publishing offers researchers options to make their published papers freely available (open access) in their standard journals and in their open access journal, (from the CSP Wikipedia entry)
Arctic Science aims to provide a collaborative approach to Arctic research for a diverse group of users including government, policy makers, the general public, and researchers across all scientific fields
FACETS is Canada’s first open access multidisciplinary science journal, aiming to advance science by publishing research that the multi-faceted global community of research. FACETS is the official journal of the Royal Society of Canada’s Academy of Science.
Anthropocene Coasts aims to understand and predict the effects of human activity, including climate change, on coastal regions.
In addition, Canadian Science Publishing strives to make their content accessible through the CSP blog that includes plain language summaries of featured research. The open-access journal FACETS similarly publishes plain language summaries.
*comment removed*
CSP announced (on Twitter) a new annual contest in 2016,
New CONTEST! Announcing Visualizing Science! Share your science images & win great prizes! Full details on the blog http://cdnsciencepub.com/blog/2016-csp-image-contest-visualizing-science.aspx1:45 PM · Sep 19, 2016·TweetDeck
The 2016 blog posting is no longer accessible. Oddly for a contest of this type, I can’t find an image archive for previous contests. Regardless, a 2020 competition has been announced for Summer 2020. There are some details on the VISUALIZING SCIENCE 2020 webpage but some are missing, e.g., no opening date, no deadline. They are encouraging you to sign up for notices.
Back to open access, in a January 22, 2016 posting I featured news about Montreal Neuro (Montreal Neurological Institute [MNI] in Québec, Canada) and its then new policy giving researchers world wide access to its research and made a pledge that it would not seek patents for its work.
Fish, Newfoundland & Labrador, and Prince Edward Island
AquAdvantage’s genetically modified salmon was approved for consumption in Canada according to my May 20, 2016 posting. The salmon are produced/farmed by a US company (AquaBounty) but the the work of genetically modifying Atlantic salmon with genetic material from the Chinook (a Pacific ocean salmon) was mostly undertaken at Memorial University in Newfoundland & Labrador.
The process by which work done in Newfoundland & Labrador becomes the property of a US company is one that’s well known here in Canada. The preliminary work and technology is developed here and then purchased by a US company, which files patents, markets, and profits from it. Interestingly, the fish farms for the AquAdvantage salmon are mostly (two out of three) located on Prince Edward Island.
Intriguingly, 4.5 tonnes of the modified fish were sold for consumption in Canada without consumers being informed (see my Sept. 13, 2017 posting, scroll down about 45% of the way).
It’s not all sunshine and roses where science culture in Canada is concerned. Incidents where Canadians are not informed let alone consulted about major changes in the food supply and other areas are not unusual. Too many times, scientists, politicians, and government policy experts want to spread news about science without any response from the recipients who are in effect viewed as a ‘tabula rasa’ or a blank page.
Tying it all up
This series has been my best attempt to document in some fashion or another the extraordinary range of science culture in Canada from roughly 2010-19. Thank you! This series represents a huge amount of work and effort to develop science culture in Canada and I am deeply thankful that people give so much to this effort.
I have inevitably missed people and organizations and events. For that I am very sorry. (There is an addendum to the series as it’s been hard to stop but I don’t expect to add anything or anyone more.)
I want to mention but can’t expand upon,the Pan-Canadian Artificial Intelligence Strategy, which was established in the 2017 federal budget (see a March 31, 2017 posting about the Vector Institute and Canada’s artificial intelligence sector).
Science Borealis, the Canadian science blog aggregator, owes its existence to Canadian Science Publishing for the support (programming and financial) needed to establish itself and, I believe, that support is still ongoing. I think thanks are also due to Jenny Ryan who was working for CSP and championed the initiative. Jenny now works for Canadian Blood Services. Interestingly, that agency added a new programme, a ‘Lay Science Writing Competition’ in 2018. It’s offered n partnership with two other groups, the Centre for Blood Research at the University of British Columbia and Science Borealis
While the Royal Astronomical Society of Canada does not fit into my time frame as it lists as its founding date December 1, 1868 (18 months after confederation), the organization did celebrate its 150th anniversary in 2018.
Vancouver’s Electric Company often produces theatrical experiences that cover science topics such as the one featured in my June 7, 2013 posting, You are very star—an immersive transmedia experience.
Let’s Talk Science (Wikipedia entry) has been heavily involved with offering STEM (science, technology, engineering, and mathematics) programming both as part of curricular and extra-curricular across Canada since 1993.
This organization predates confederation having been founded in 1849 by Sir Sandford Fleming and Kivas Tully in Toronto. for surveyors, civil engineers, and architects. It is the Royal Canadian Institute of Science (Wikipedia entry)_. With almost no interruption, they have been delivering a regular series of lectures on the University of Toronto campus since 1913.
The Perimeter Institute for Theoretical Physics is a more recent beast. In 1999 Mike Lazirides, founder of Research In Motion (now known as Blackberry Limited), acted as both founder and major benefactor for this institute in Waterloo, Ontario. They offer a substantive and imaginative outreach programmes such as Arts and Culture: “Event Horizons is a series of unique and extraordinary events that aim to stimulate and enthral. It is a showcase of innovative work of the highest international standard, an emotional, intellectual, and creative experience. And perhaps most importantly, it is a social space, where ideas collide and curious minds meet.”
While gene-editing hasn’t seemed to be top-of-mind for anyone other than those in the art/sci community that may change. My April 26, 2019 posting focused on what appears to be a campaign to reverse Canada’s criminal ban on human gene-editing of inheritable cells (germline). With less potential for controversy, there is a discussion about somatic gene therapies and engineered cell therapies. A report from the Council of Canadian is due in the Fall of 2020. (The therapies being discussed do not involve germline editing.)
French language science media and podcasting
Agence Science-Presse is unique as it is the only press agency in Canada devoted to science news. Founded in 1978, it has been active in print, radio, television, online blogs, and podcasts (Baladodiffusion). You can find their Twitter feed here.
I recently stumbled across ‘un balados’ (podcast), titled, 20%. Started in January 2019 by the magazine, Québec Science, the podcast is devoted to women in science and technology. 20%, the podcast’s name, is the statistic representing the number of women in those fields. “Dans les domaines de la science et de la technologie, les femmes ne forment que 20% de la main-d’oeuvre.” (from the podcast webpage) The podcast is a co-production between “Québec Science [founded in 1962] et l’Acfas [formerly, l’Association Canadienne-Française pour l’Avancement des Sciences, now, Association francophone pour le savoir], en collaboration avec la Commission canadienne pour l’UNESCO, L’Oréal Canada et la radio Choq.ca.” (also from the podcast webpage)
Does it mean anything?
There have been many developments since I started writing this series in late December 2019. In January 2020, Iran shot down one of its own planes. That error killed some 176 people , many of them (136 Canadians and students) bound for Canada. The number of people who were involved in the sciences, technology, and medicine was striking.
It was a shocking loss and will reverberate for quite some time. There is a memorial posting here (January 13, 2020), which includes links to another memorial posting and an essay.
As I write this we are dealing with a pandemic, COVID-19, which has us all practicing physical and social distancing. Congregations of large numbers are expressly forbidden. All of this is being done in a bid to lessen the passage of the virus, SARS-CoV-2 which causes COVID-19.
In the short term at least, it seems that much of what I’ve described in these five parts (and the addendum) will undergo significant changes or simply fade away.
As for the long term, with this last 10 years having hosted the most lively science culture scene I can ever recall, I’m hopeful that science culture in Canada will do more than survive but thrive.
*”for-profit publisher, Canadian Science Publishing (CSP)” corrected to “not-for-profit publisher, Canadian Science Publishing (CSP)” and this comment “Not bad for a for-profit business, eh?” removed on April 29, 2020 as per Twitter comments,
Hi Maryse, thank you for alerting us to your blog. To clarify, Canadian Science Publishing is a not-for-profit publisher. Thank you as well for sharing our image contest. We’ve updated the contest page to indicate that the contest opens July 2020!
The US Department of Agriculture has a very interesting funding opportunity, Higher Education Challenge (HEC) Grants Program, as evidenced by the Nano 2020 virtual reality (VR) classroom initiative. Before launching into the specifics of the Nano 2020 project, here’s a description of the funding program,
Projects supported by the Higher Education Challenge Grants Program will: (1) address a state, regional, national, or international educational need; (2) involve a creative or non-traditional approach toward addressing that need that can serve as a model to others; (3) encourage and facilitate better working relationships in the university science and education community, as well as between universities and the private sector, to enhance program quality and supplement available resources; and (4) result in benefits that will likely transcend the project duration and USDA support.
A February 3, 2020 University of Arizona news release by Stacy Pigott (also on EurekAlert but published February 7, 2020) announced a VR classroom where students will be able to interact with nanoscale data gained from agricultural sciences and the life sciences,
Sometimes the smallest of things lead to the biggest ideas. Case in point: Nano 2020, a University of Arizona-led initiative to develop curriculum and technology focused on educating students in the rapidly expanding field of nanotechnology.
The five-year, multi-university project recently met its goal of creating globally relevant and implementable curricula and instructional technologies, to include a virtual reality classroom, that enhance the capacity of educators to teach students about innovative nanotechnology applications in agriculture and the life sciences.
Here’s a video from the University of Arizona’s project proponents which illustrates their classroom,
For those who prefer text or like to have it as a backup, here’s the rest of the news release explaining the project,
Visualizing What is Too Small to be Seen
Nanotechnology involves particles and devices developed and used at the scale of 100 nanometers or less – to put that in perspective, the average diameter of a human hair is 80,000 nanometers. The extremely small scale can make comprehension challenging when it comes to learning about things that cannot be seen with the naked eye.
That’s where the Nano 2020 virtual reality classroom comes in. In a custom-developed VR classroom complete with a laboratory, nanoscale objects come to life for students thanks to the power of science data visualization.
Within the VR environment, students can interact with objects of nanoscale proportions – pick them up, turn them around and examine every nuance of things that would otherwise be too small to see. Students can also interact with their instructor or their peers. The Nano 2020 classroom allows for multi-player functionality, giving educators and students the opportunity to connect in a VR laboratory in real time, no matter where they are in the world.
“The virtual reality technology brings to life this complex content in a way that is oddly simple,” said Matt Mars, associate professor of agricultural leadership and innovation education in the College of Agriculture and Life Sciences and co-director of the Nano 2020 grant. “Imagine if you can take a student and they see a nanometer from a distance, and then they’re able to approach it and see how small it is by actually being in it. It’s mind-blowing, but in a way that students will be like, ‘Oh wow, that is really cool!'”
The technology was developed by Tech Core, a group of student programmers and developers led by director Ash Black in the Eller College of Management.
“The thing that I was the most fascinated with from the beginning was playing with a sense of scale,” said Black, a lifelong technologist and mentor-in-residence at the McGuire Center for Entrepreneurship. “What really intrigued me about virtual reality is that it is a tool where scale is elastic – you can dial it up and dial it down. Obviously, with nanotechnology, you’re dealing with very, very small things that nobody has seen yet, so it seemed like a perfect use of virtual reality.”
Black and Tech Core students including Robert Johnson, Hazza Alkaabi, Matthew Romero, Devon Oberdan, Brandon Erickson and Tim Lukau turned science data into an object, the object into an image, and the image into a 3D rendering that is functional in the VR environment they built.
“I think that being able to interact with objects of nanoscale data in this environment will result in a lot of light bulbs going off in the students’ minds. I think they’ll get it,” Black said. “To be able to experience something that is abstract – like, what does a carbon atom look like – well, if you can actually look at it, that’s suddenly a whole lot of context.”
The VR classroom complements the Nano 2020 curriculum, which globally expands the opportunities for nanotechnology education within the fields of agriculture and the life sciences.
Teaching the Workforce of the Future
“There have been great advances to the use of nanotechnology in the health sciences, but many more opportunities for innovation in this area still exist in the agriculture fields. The idea is to be able to advance these opportunities for innovation by providing some educational tools,” said Randy Burd, who was a nutritional sciences professor at the University of Arizona when he started the Nano 2020 project with funding from a National Institute of Food and Agriculture Higher Education Challenge grant through the United States Department of Agriculture. “It not only will give students the basics of the understanding of the applications, but will give them the innovative thought processes to think of new creations. That’s the real key.”
Unknown Object
The goal of the Nano 2020 team, which includes faculty from the University of Arizona, Northern Arizona University and Johns Hopkins University, was to create an online suite of undergraduate courses that was not university-specific, but could be accessed and added to by educators to reach students around the world.
To that end, the team built modular courses in nanotechnology subjects such as glycobiology, optical microscopy and histology, nanomicroscopy techniques, nutritional genomics, applications of magnetic nanotechnology, and design, innovation, and entrepreneurship, to name a few. An online library will be created to facilitate the ongoing expansion of the open-source curricula, which will be disseminated through novel technologies such as the virtual reality classroom.
“It isn’t practical to think that other universities and colleges are just going to be able to launch new courses, because they still need people to teach those courses,” Mars said. “So we created a robust and flexible set of module-based course packages that include exercises, lectures, videos, power points, tools. Instructors will be able to pull out components and integrate them into what already exists to continue to move toward a more comprehensive offering in nanotechnology education.”
According to Mars, the highly adaptable nature of the curriculum and the ability to deliver it in various ways were key components of the Nano 2020 project.
“We approach the project with a strong entrepreneurial mindset and heavy emphasis on innovation. We wanted it to be broadly defined and flexible in structure, so that other institutions access and model the curricula, see its foundation, and adapt that to what their needs were to begin to disseminate the notion of nanotechnology as an underdeveloped but really important field within the larger landscape of agriculture and life sciences,” Mars said. “We wanted to also provide an overlay to the scientific and technological components that would be about adoption in human application, and we approached that through an innovation and entrepreneurial leadership lens.”
Portions of the Nano 2020 curriculum are currently being offered as electives in a certificate program through the Department of Agriculture Education, Technology and Innovation at the University of Arizona. As it becomes more widely disseminated through the higher education community at large, researchers expect the curriculum and VR classroom technology to transcend the boundaries of discipline, institution and geography.
“An online open platform will exist where people can download components and courses, and all of it is framed by the technology, so that these experiences and research can be shared over this virtual reality component,” Burd said. “It’s technologically distinct from what exists now.”
“The idea is that it’s not just curriculum, but it’s the delivery of that curriculum, and the delivery of that curriculum in various ways,” Mars said. “There’s a relatability that comes with the virtual reality that I think is really cool. It allows students to relate to something as abstract as a nanometer, and that is what is really exciting.”
As best I can determine, this VR Nano 2020 classroom is not yet ready for a wide release and, for now, is being offered exclusively at the University of Arizona.
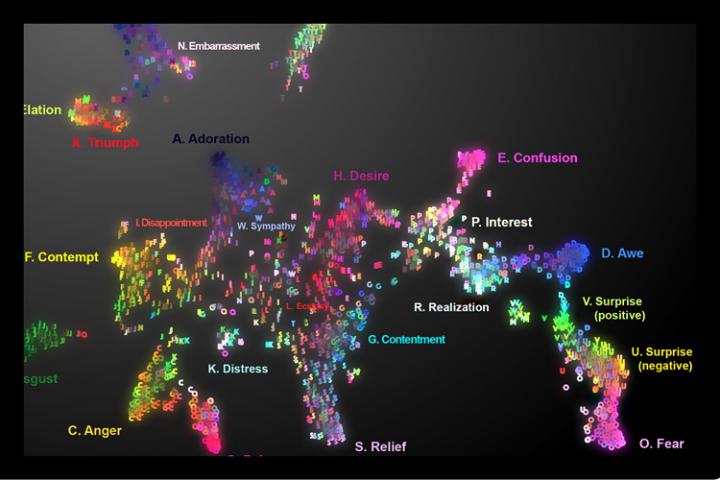
Caption: Audio map of vocal bursts across 24 emotions. To visit the online map and hear the sounds, go to https://s3-us-west-1.amazonaws.com/vocs/map.html# and move the cursor across the map. Credit: Courtesy of Alan Cowen
The real map, not the the image of the map you see above, offers a disconcerting (for me, anyway) experience. Especially since I’ve just finished reading Lisa Feldman Barrett’s 2017 book, How Emotions are Made, where she presents her theory of ‘constructed emotion. (There’s more about ‘constructed emotion’ later in this post.)
Ooh, surprise! Those spontaneous sounds we make to express everything from elation (woohoo) to embarrassment (oops) say a lot more about what we’re feeling than previously understood, according to new research from the University of California, Berkeley.
Proving that a sigh is not just a sigh [a reference to the song, As Time Goes By? The lyric is “a kiss is still a kiss, a sigh is just a sigh …”], UC Berkeley scientists conducted a statistical analysis of listener responses to more than 2,000 nonverbal exclamations known as “vocal bursts” and found they convey at least 24 kinds of emotion. Previous studies of vocal bursts set the number of recognizable emotions closer to 13.
The results, recently published online in the American Psychologist journal, are demonstrated in vivid sound and color on the first-ever interactive audio map of nonverbal vocal communication.
“This study is the most extensive demonstration of our rich emotional vocal repertoire, involving brief signals of upwards of two dozen emotions as intriguing as awe, adoration, interest, sympathy and embarrassment,” said study senior author Dacher Keltner, a psychology professor at UC Berkeley and faculty director of the Greater Good Science Center, which helped support the research.
For millions of years, humans have used wordless vocalizations to communicate feelings that can be decoded in a matter of seconds, as this latest study demonstrates.
“Our findings show that the voice is a much more powerful tool for expressing emotion than previously assumed,” said study lead author Alan Cowen, a Ph.D. student in psychology at UC Berkeley.
On Cowen’s audio map, one can slide one’s cursor across the emotional topography and hover over fear (scream), then surprise (gasp), then awe (woah), realization (ohhh), interest (ah?) and finally confusion (huh?).
Among other applications, the map can be used to help teach voice-controlled digital assistants and other robotic devices to better recognize human emotions based on the sounds we make, he said.
As for clinical uses, the map could theoretically guide medical professionals and researchers working with people with dementia, autism and other emotional processing disorders to zero in on specific emotion-related deficits.
“It lays out the different vocal emotions that someone with a disorder might have difficulty understanding,” Cowen said. “For example, you might want to sample the sounds to see if the patient is recognizing nuanced differences between, say, awe and confusion.”
Though limited to U.S. responses, the study suggests humans are so keenly attuned to nonverbal signals – such as the bonding “coos” between parents and infants – that we can pick up on the subtle differences between surprise and alarm, or an amused laugh versus an embarrassed laugh.
For example, by placing the cursor in the embarrassment region of the map, you might find a vocalization that is recognized as a mix of amusement, embarrassment and positive surprise.
A tour through amusement reveals the rich vocabulary of laughter and a spin through the sounds of adoration, sympathy, ecstasy and desire may tell you more about romantic life than you might expect,” said Keltner.
Researchers recorded more than 2,000 vocal bursts from 56 male and female professional actors and non-actors from the United States, India, Kenya and Singapore by asking them to respond to emotionally evocative scenarios.
Next, more than 1,000 adults recruited via Amazon’s Mechanical Turk online marketplace listened to the vocal bursts and evaluated them based on the emotions and meaning they conveyed and whether the tone was positive or negative, among several other characteristics.
A statistical analysis of their responses found that the vocal bursts fit into at least two dozen distinct categories including amusement, anger, awe, confusion, contempt, contentment, desire, disappointment, disgust, distress, ecstasy, elation, embarrassment, fear, interest, pain, realization, relief, sadness, surprise (positive) surprise (negative), sympathy and triumph.
For the second part of the study, researchers sought to present real-world contexts for the vocal bursts. They did this by sampling YouTube video clips that would evoke the 24 emotions established in the first part of the study, such as babies falling, puppies being hugged and spellbinding magic tricks.
This time, 88 adults of all ages judged the vocal bursts extracted from YouTube videos. Again, the researchers were able to categorize their responses into 24 shades of emotion. The full set of data were then organized into a semantic space onto an interactive map.
“These results show that emotional expressions color our social interactions with spirited declarations of our inner feelings that are difficult to fake, and that our friends, co-workers, and loved ones rely on to decipher our true commitments,” Cowen said.
The writer assumes that emotions are pre-existing. Somewhere, there’s happiness, sadness, anger, etc. It’s the pre-existence that Lisa Feldman Barret challenges with her theory that we construct our emotions (from her Wikipedia entry),
She highlights differences in emotions between different cultures, and says that emotions “are not triggered; you create them. They emerge as a combination of the physical properties of your body, a flexible brain that wires itself to whatever environment it develops in, and your culture and upbringing, which provide that environment.”
You can find Barrett’s December 6, 2017 TED talk here wheres she explains her theory in greater detail. One final note about Barrett, she was born and educated in Canada and now works as a Professor of Psychology at Northeastern University, with appointments at Harvard Medical School and Massachusetts General Hospital at Northeastern University in Boston, Massachusetts; US.
A February 7, 2019 by Mark Wilson for Fast Company delves further into the 24 emotion audio map mentioned at the outset of this posting (Note: Links have been removed),
Fear, surprise, awe. Desire, ecstasy, relief.
These emotions are not distinct, but interconnected, across the gradient of human experience. At least that’s what a new paper from researchers at the University of California, Berkeley, Washington University, and Stockholm University proposes. The accompanying interactive map, which charts the sounds we make and how we feel about them, will likely persuade you to agree.
At the end of his article, Wilson also mentions the Dalai Lama and his Atlas of Emotions, a data visualization project, (featured in Mark Wilson’s May 13, 2016 article for Fast Company). It seems humans of all stripes are interested in emotions.
Here’s a link to and a citation for the paper about the audio map,
“Quantum Rhapsodies” combines a narrative script, video images and live music by the Jupiter String Quartet to explore the world of quantum physics. The performance will premiere April 10 [2019] at the Beckman Institute for Advanced Science and Technology. Courtesy Beckman Institute for Advanced Science and Technology
Here’s more about Quantum Rhapsodies, a free public art/science music performance at the University of Illinois on April 10, 2019, from an April 5, 2019 University of Illinois news release (also here) by Jodi Heckel,
A new performance that explores the world of quantum physics will feature the music of the Jupiter String Quartet, a fire juggler and a fantastical “Alice in Quantumland” scene.
“Quantum Rhapsodies,” the vision of physics professor Smitha Vishveshwara, looks at the foundational developments in quantum physics, the role it plays in our world and in technology such as the MRI, and the quantum mysteries that remain unanswered.
“The quantum world is a world that inspires awe, but it’s also who we are and what we are made of,” said Vishveshwara, who wrote the piece and guided the visuals.
The performance will premiere April 10 [2019] as part of the 30th anniversary celebration of the Beckman Institute for Advanced Science and Technology. The event begins with a 5 p.m. reception, followed by the performance at 6 p.m. and a meet-and-greet with the show’s creators at 7 p.m. The performance will be in the atrium of the Beckman Institute, 405 N. Mathews Ave., Urbana, [emphases mine] and it is free and open to the public. While the available seating is filling up, the atrium space will allow for an immersive experience in spite of potentially restricted viewing.
The production is a sister piece to “Quantum Voyages,” a performance created in 2018 by Vishveshwara and theatre professor Latrelle Bright to illustrate the basic concepts of quantum physics. It was performed at a quantum physics conference celebrating Nobel Prize-winning physicist Anthony Leggett’s 80th birthday in 2018.
While “Quantum Voyages” was a live theater piece, “Quantum Rhapsodies” combines narration by Bright, video images and live music from the Jupiter String Quartet. It ponders the wonder of the cosmos, the nature of light and matter, and the revolutionary ideas of quantum physics. A central part of the narrative involves the theory of Nobel Prize-winning French physicist Louis de Broglie that matter, like light, can behave as a wave.
The visuals – a blend of still images, video and animation – were created by a team consisting of the Beckman Visualization Laboratory; Steven Drake, a video producer at Beckman; filmmaker Nic Morse of Protagonist Pizza Productions; and members of a class Vishveshwara teaches, Where the Arts Meet Physics.
The biggest challenge in illustrating the ideas in the script was conveying the scope of the piece, from the galactic scale of the cosmos to the subatomic scale of the quantum world, Drake said. The concepts of quantum physics “are not something you can see. It’s theoretical or so small you can’t put it under a microscope or go out into the real world and film it,” he said.
Much of the work involved finding images, both scientific and artistic, that would help illustrate the concepts of the piece and complement the poetic language that Vishveshwara used, as well as the music.
Students and teaching assistant Danielle Markovich from Vishveshwara’s class contributed scientific images and original paintings. Drake used satellite images from the Hubble Space Telescope and other satellites, as well as animation created by the National Center for Supercomputing Applications in its work with NASA, for portions of the script talking about the cosmos. The Visualization Laboratory provided novel scientific visualizations.
“What we’re good at doing and have done for years is taking research content and theories and visualizing that information. We do that for a very wide variety of research and data. We’re good at coming up with images that represent these invisible worlds, like quantum physics,” said Travis Ross, the director of the lab.
Some ideas required conceptual images, such as footage by Morse of a fire juggler at Allerton Park to represent light and of hands moving to depict the rotational behavior of water-based hydrogen within a person in an MRI machine.
Motion was incorporated into a painting of a lake to show water rippling and light flickering across it to illustrate light waves. In the “Alice in Quantumland” sequence, a Mad Hatter’s tea party filmed at the Illini Union was blended with cartoonlike animated elements into the fantasy sequence by Jose Vazquez, an illustrator and concept artist who works in the Visualization Lab.
“Our main objective is making sure we’re representing it in a believable way that’s also fun and engaging,” Ross said. “We’ve never done anything quite like this. It’s pretty unique.”
In addition to performing the score, members of the Jupiter String Quartet were the musical directors, creating the musical narrative to mesh with the script. The music includes contemplative compositions by Beethoven to evoke the cosmos and playful modern compositions that summon images of the movements of particles and waves.
“I was working with such talented people and creative minds, and we had fun and came up with these seemingly absurd ideas. But then again, it’s like that with the quantum world as well,” Vishveshwara said.
“My hope is not necessarily for people to understand everything, but to infuse curiosity and to feel the grandness and the beauty that is part of who we are and the cosmos that we live in,” she said..
Here’s a preview of this free public performance,
How to look at SciArt (also known as, art/science depending on your religion)
There’s an intriguing April 8, 2019 post on the Science Borealis blog by Katrina Vera Wong and Raymond Nakamura titled: How to look at (and appreciate) SciArt,
….
The recent #SciArt #TwitterStorm, in which participants tweeted their own sciart and retweeted that of others, illustrated the diversity of approaches to melding art and science. With all this work out there, what can we do, as advocates of art and science, to better appreciate sciart? We’d like to foster interest in, and engagement with, sciart so that its value goes beyond how much it costs or how many likes it gets.
An article by Kit Messham-Muir based on the work of art historian Erwin Panofsky outlines a three-step strategy for looking at art: Look. See. Think. Looking is observing what the elements are. Seeing draws meaning from it. Thinking links personal experience and accessible information to the piece at hand.
Looking and seeing is also part of the Visual Thinking Strategies (VTS) method originally developed for looking at art and subsequently applied to science and other subjects as a social, object-oriented learning process. It begins by asking, “What is going on here?”, followed by “What do you see that makes you think that?” This allows learners of different backgrounds to participate and encourages the pursuit of evidence to back up opinions.
Let’s see how these approaches might work on your own or in conversation. Take, for example, the following work by natural history illustrator Julius Csotonyi:
…
I hope some of our Vancouver-based (Canada) art critics get a look at some of this material. I read a review a few years ago and the critic seemed intimidated by the idea of looking at work that explicitly integrated and reflected on science. Since that time (Note: there aren’t that many art reviewers here), I have not seen another attempt by an art critic.
Here’s the latest from a November 20, 2018 ArtSci Salon announcement received via email,
Paint to Programming: exploring the role of algorithms in SciArt
Description
What is the role of programming in artwork creation? is programming preliminary a Medium to be hidden to an audience more interested in the interface rather than in its algorithmic content ? or is it both medium and content, revealing the inner working, the politics, and the tactical/strategic uses of code and algorithmic complexity in a culture increasingly withdrawn from its crucial implications?
Thanks to a collaboration between Art the Science and ArtSci Salon, this event is meant to initiate a conversation to understand the many uses of algorithms in artistic and scientific research, from ways to solve problems in fluid mechanics by drawing inspiration from the dripping technique of Jackson Pollock, to exploring and making visible the complex dynamics of the blockchain, to using algorithms to process and display data for science communication.
Join ArtSci Salon and Art the Science at Fields for an evening of presentation and discussion with:
Julia Krolik is the founder and Chief Executive Officer of Art the Science, an organization dedicated to uniting and empowering artists and scientists to collectively advance scientific knowledge. As an exhibiting artist, focusing on science, art and new media, Julia has created works for CBC, the Ontario Science Centre, the Toronto Urban Film Festival and the Scotia Bank Photography Festival.
Owen Fernley is an engineer and experimentalist. He has experience programming computational engines in Fortran and C and is currently building front-end web tools in javascript to aid in exploration geology.He co-created Decomposing Pianos, an experimental music collective focusing on projects related to art, science, experimental music and new media.
Sarah Friend is an artist and software engineer working at a large blockchain development studio. When not doing that, she creates games and other interactive experiences. Her practice investigates murky dichotomies – like those between privacy and transparency, centralization and decentralization, and the environment and technology – with playfulness and absurdist humour.
Bernardo Palacios Muñiz is a mechanical engineer and a researcher from Mexico City. His thesis at UNAM “Descifrando a Pollock: Arte y Mecánica de Fluidos” explored the technique inplemented by Jackson POllock through the perspective of fluid mechanics
Like so many of the events from the ArtSci salon, this is very timely. On a somewhat related note, there’s an art/AI emergence mentioned in my August 31, 2018 posting (scroll down about 70% of the way to this subhead ‘Artworks generated by an AI system are to be sold at Christie’s auction house’).
I’ve also mentioned ArtSci Salon’s presentation partner, Art the Science, in an October 23, 2017 posting. Amongst other programmes, they advertise and promote artist residencies. I notice that their events are held exclusively in Ontario and the descriptions for participants in their 2018 online gallery exhibit feature a preponderance of Ontario-based artists. I’m sure they’d like to get more participation from across the country but that takes extra time and effort and volunteer organizations such as this one don’t have much of either to spare. Their three year life (they were founded in 2015) is quite an accomplishment.
As for a more national art/sci or sciart network, maybe it’s time to organize something, eh?